반응형
1. 산점도 그리기
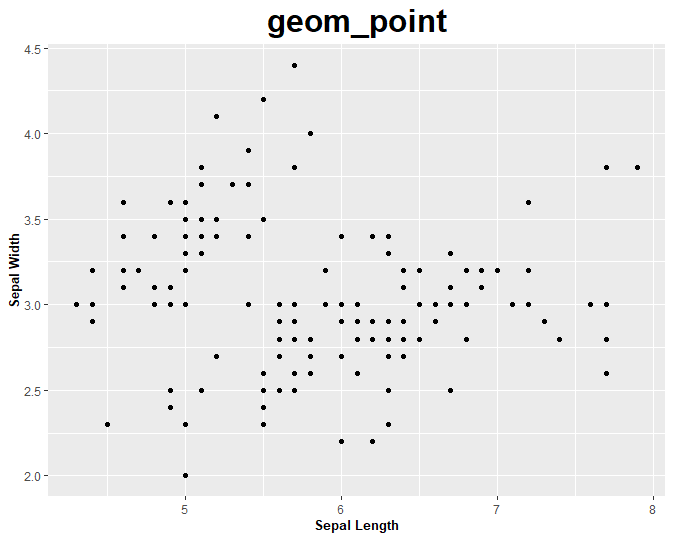
내장데이터인 iris 를 이용하여 산점도를 그려보았습니다. 주요한 옵션들만 넣었습니다. 주요 옵션은 제목, 축이름, 서식, 가운데정렬입니다. 설명은 주석으로 대신합니다.
library(tidyverse)

ggplot(data=iris,aes(x=Sepal.Length,y=Sepal.Width))+
  geom_point()+
  labs(title="geom_point",x='Sepal Length',y='Sepal Width')+ #제목, 축이름
  theme(title = element_text(size=20,face='bold'))+          #제목 서식
  theme(axis.title = element_text(size=10,face='bold'))+     #축서식
  theme(plot.title = element_text(hjust = 0.5))              #제목 가운데 정렬

x,y 축의 범위를 설정하고 싶은 경우 아래 함수를 사용합니다 .
  scale_x_continuous(limits = c(0, 10))+
  scale_y_continuous(limits = c(0, 10))
2. 산점도 그룹별로 그리기 (색으로 구분)
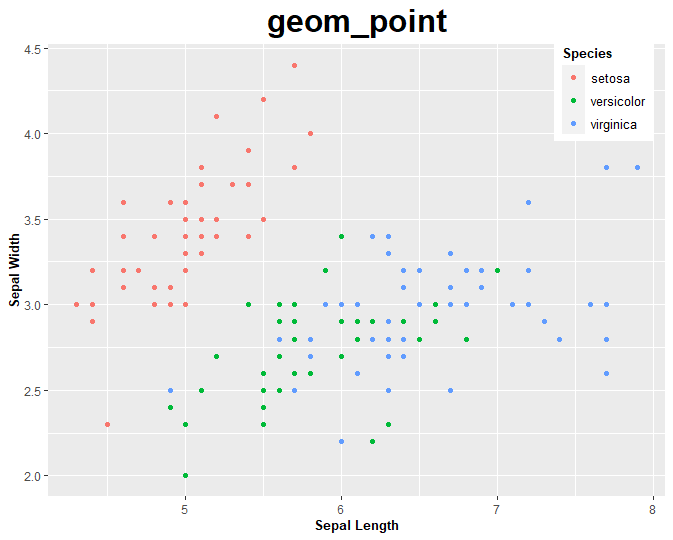
데이터프레임에 그룹을 나누는 열이 있다면, 각 그룹별로 그래프를 그릴 수도 있습니다. iris 데이터에는 Species 라는 열이 있는데 품종을 구분하는 열입니다. Species 열을 이용하여 그룹별로 그래프를 그려봅시다.
library(tidyverse)

ggplot(data=iris,aes(x=Sepal.Length,y=Sepal.Width,color=Species))+
  geom_point()+
  labs(title="geom_point",x='Sepal Length',y='Sepal Width')+ #제목, 축이름
  theme(title = element_text(size=20,face='bold'))+          #제목 서식
  theme(axis.title = element_text(size=10,face='bold'))+     #축서식
  theme(plot.title = element_text(hjust = 0.5))+             #제목 가운데 정렬
  theme(legend.title = element_text(size=10,face='bold'))+   #범례 제목 서식
  theme(legend.text = element_text(size=10))+                #범례 이름 서식
  theme(legend.position = c(0.9,0.9))                        #범례 위치

범례의 위치설정에는 아래와 같은 선택지도 있습니다.
legend.position = 'left'
legend.position = 'top'
legend.position = 'right'
legend.position = 'bottom'
3. 산점도 그룹별로 그리기 (색+모양으로 구분)
위에서 그린 그래프를 색 뿐만 아니라 모양으로도 그룹을 구분해 봅시다.
library(tidyverse)

ggplot(data=iris,aes(x=Sepal.Length,y=Sepal.Width,shape=Species,color=Species))+
  geom_point()+
  labs(title="geom_point",x='Sepal Length',y='Sepal Width')+ #제목, 축이름
  theme(title = element_text(size=20,face='bold'))+          #제목 서식
  theme(axis.title = element_text(size=10,face='bold'))+     #축서식
  theme(plot.title = element_text(hjust = 0.5))+             #제목 가운데 정렬
  theme(legend.title = element_text(size=10,face='bold'))+   #범례 제목 서식
  theme(legend.text = element_text(size=10))+                #범례 이름 서식
  theme(legend.position = c(0.9,0.9))                        #범례 위치

반응형
'R tidyverse > 하루만에 끝내는 ggplot2' 카테고리의 다른 글
| [ggplot2의 이해] 6. 원소 수를 출력하는 막대그래프 (geom_bar) (0) | 2023.02.07 |
|---|---|
| [ggplot2의 이해] 5. 박스플롯 (geom_boxplot) (0) | 2023.02.06 |
| [ggplot2의 이해] 4. 선그래프 (geom_line) (0) | 2023.02.06 |
| [ggplot2의 이해] 2. ggplot2의 기본구조 (0) | 2023.01.28 |
| [ggplot2의 이해] 1. ggplot2란 무엇인가? (0) | 2023.01.27 |


댓글